Work samples · Selected work

Portfolio

BI systems and operational programs I’ve built — from Justified Analytics (founder practice) to construction analytics, labor forecasting, inventory control, and process automation.

01

Justified Analytics

A BI practice I built — data that works as hard as you do. Historical offerings and delivery model below.
Justified Analytics logo

Practice I built · founder-led BI

Custom dashboards, reconciliation workflows, Excel solutions, and data repositories for teams that need clarity without enterprise bloat. Delivery: connect data → define vision (30 min) → build in 1–2 weeks for starter engagements.
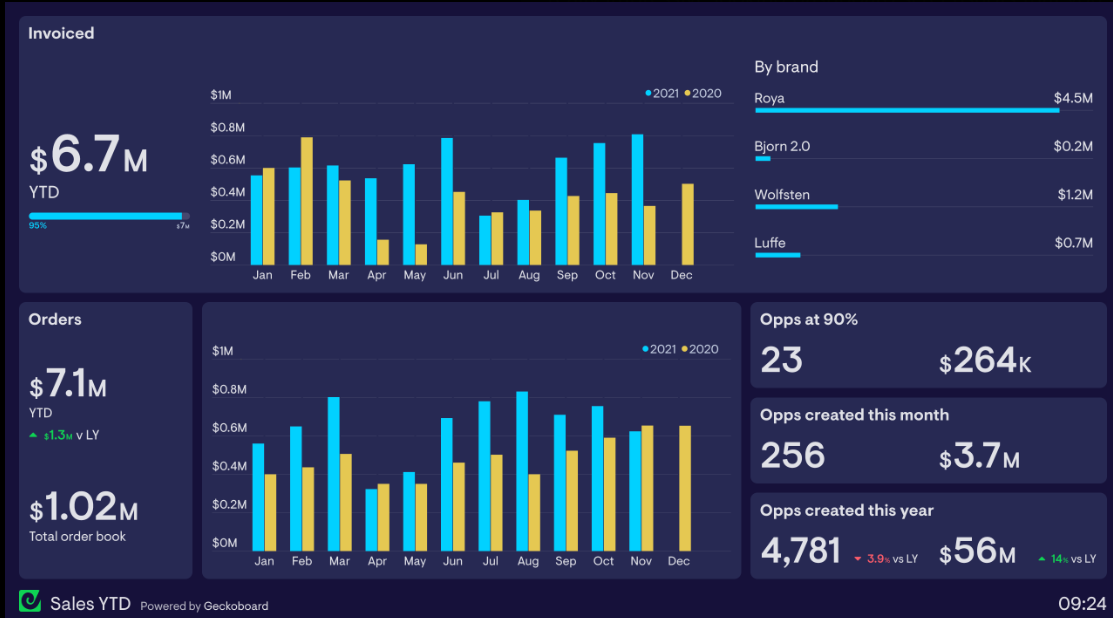
Sales YTD business intelligence dashboard — practice demo visual from Justified Analytics
Sales YTD dashboard · practice demo visual (Geckoboard-style BI)

Services (Justified Analytics positioning)

01

Business Intelligence Dashboards

Interactive, decision-ready views for sales, ops, and leadership — hosted where stakeholders can actually use them.

02

Data Reconciliation

Align source systems, clear mismatches, and make the numbers trustworthy before they hit the board deck.

03

Custom Excel Solutions

Models, automation, and operator-friendly workbooks when a full BI stack isn’t the right first move.

04

Data Repository Management

Durable structure for sources, refreshes, and ownership so reporting doesn’t restart from scratch every quarter.

Selected practice work (demos / sample layouts — not client-confidential metrics)

Sales and ops style BI dashboard practice demo

Practice demo

Sales & Ops Dashboard — Director

Director-level sales and operations view: YTD invoicing vs target, brand mix, order book, and opportunity pipeline in one glance.

Analytics concept visual for financial dashboard practice work

Practice demo

Financial Dashboard — Manager

Manager-facing financial and performance layout for tracking targets, variance, and operational health without drowning in tabs.

Packages (historical JA offering)

Starter $2,500
  • 1 dashboard
  • Up to 2 sources
  • 1–2 weeks
Growth $5,000–$7,500
  • 2–3 dashboards
  • Up to 5 sources
  • 3–4 weeks
Premium $10,000–$15,000
  • Unlimited dashboards/sources
  • Advanced analytics
  • 6–8 weeks
Retainer $1,500–$3,000/mo
  • Ongoing support
  • Iteration & refresh
  • Priority access
BOT

Intake GPT — lead qualification

Conversational intake → package recommendation → summary routed to Justin. Built to qualify leads without a sales funnel tax.

02

Selected case studies

Problem → approach → outcome from career roles across construction BI, ops planning, automation, and inventory.
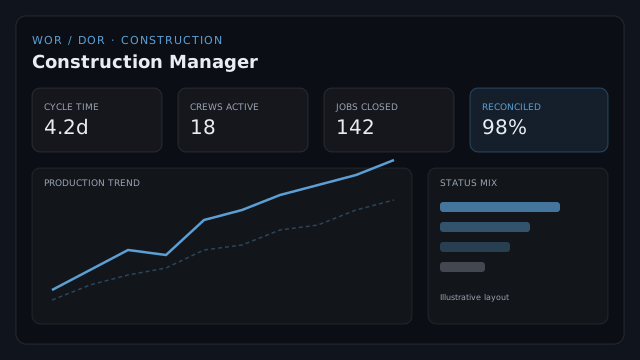
Illustrative construction BI dashboard layout Illustrative layout

PG&E / Evergreen · Current
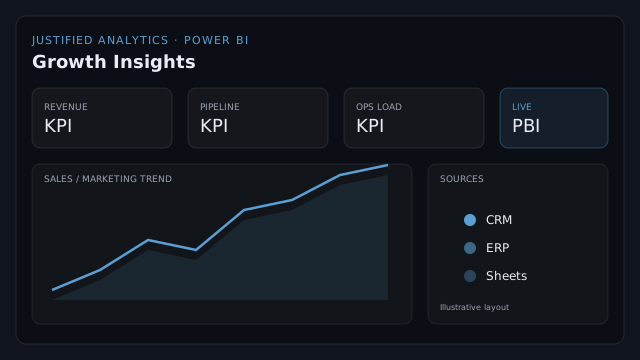
Construction BI

Problem
Paving / construction ops needed decision-ready visibility across daily work, managers, and cycle time — plus cleaner invoice reconciliation.
Approach
Primary BI for WOR/DOR reporting, Construction Manager Dashboard, production / cycle-time analytics, and the PgClean invoice reconciliation tool.
Outcome
Analytical frameworks that support operational and cost-related decision-making for PG&E paving operations.
Illustrative BI dashboard layout Illustrative layout

Peaxy

BI dashboards for labor cost

Problem
Operations leadership needed clearer labor visibility to control cost without slowing delivery.
Approach
Partnered with VP of Operations and CEO; built BI dashboards and visualization for large operational datasets.
Outcome
Dashboards that contributed to a 15% labor cost reduction.
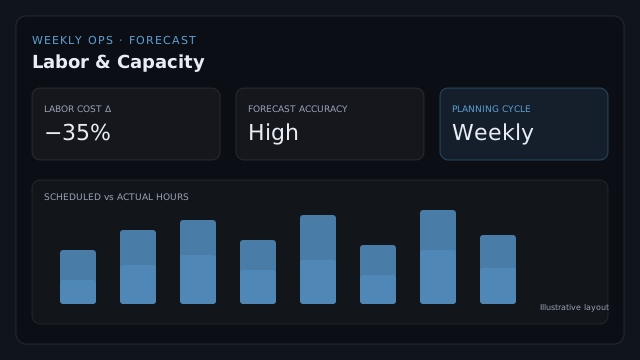
Illustrative weekly ops planning dashboard layout Illustrative layout

Stuart Event Rentals
Weekly Ops Planning + forecasting

Problem
Warehouse, field, and transportation labor needed a repeatable planning rhythm and forecast discipline.
Approach
Built and ran a Weekly Ops Planning System; automated labor forecasting and developed a structural load-list calculator.
Outcome
35% average monthly labor cost reduction.
Illustrative automation quality dashboard layout Illustrative layout

MSC · MsClean
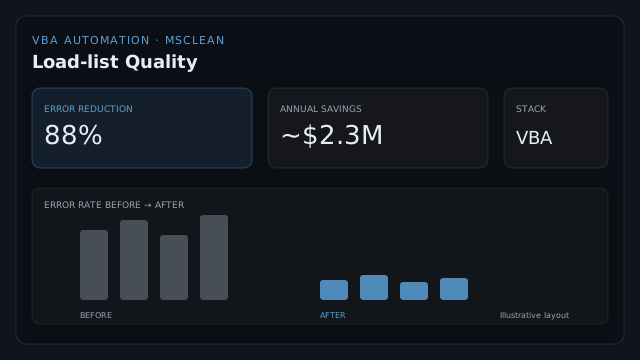
VBA automation for vessel reconciliation

Problem
Load-list errors in vessel reconciliation workflows were driving costly rework.
Approach
Built MsClean VB automation for vessel reconciliation; led Excel help desk and training around the new workflow.
Outcome
88% load-list error reduction (~$2.3M annual savings).
Illustrative inventory accuracy dashboard layout Illustrative layout

CEVA Logistics · Tesla contract

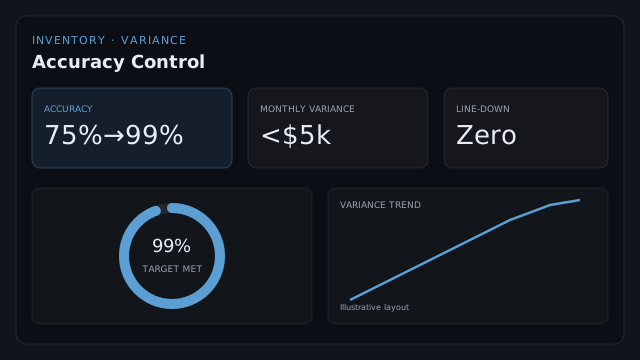
Inventory accuracy & variance control

Problem
Inventory accuracy and monthly variance were undermining reliable supply for Tesla operations.
Approach
Led ops with 16 direct reports and 250+ hourly associates; drove Six Sigma Kaizen efforts focused on accuracy and variance.
Outcome
Inventory accuracy from 75% to 99%; variance to <$5k/mo; maintained zero line-down for Tesla.